前言
Leafer.js 是最近新开源的一个 2D 图形绘制库,根据宣传文章中所言:速度很快,性能极高,资源占用极低。
正好,本来也要记录一篇开发中在绘图时应用数学的笔记,同时尝试一下 leafer.js。
LeaferJS宣传文章:点击跳转
LeaferJS官网:点击跳转
Leafer 尝鲜
本篇只是尝鲜文章,初衷是记录一篇开发中遇到数学问题的笔记,所以不对过多用法进行讲解,如果感兴趣的人多,我再另出一篇。
安装 leafer-ui
Leafer UI 是基于 Leafer 开发的一套 UI 绘图框架,可结合 AI 绘图、生成界面,提供了常用的 UI 绘图组件,后面全部以 leafer 简称。
基本环境
为了方便测试,我直接通过 vue-cli 创建了一个项目
初始化一个 DOM 容器,并设置高度为 100%, 后续所有方法 我们默认放到 nextTick 中执行。
1
2
3
4
5
6
7
8
9
10
11
12
13
14
| <script setup>
import { nextTick } from 'vue'
nextTick(()=> {})
</script>
<template>
<main id="main"></main>
</template>
<style scoped>
#main {
height: 100%;
}
</style>
|
创建一个应用
这里的创建一个应用,其实就是创建一个实例,或者说是画布,创建好画布之后,可以在画布上进行绘制元素。
创建画布时可以传入 width 和 height 规定大小,如果不传则会自动计算容器的大小。
1
2
3
4
5
6
7
8
9
| const leafer = new Leafer({
view: 'main',
fill: '#fff',
start: false
})
|
创建一个图形
Leafer 支持矩形、圆形、多边形、多角星形、直线
通过这些基础图形类型可以延伸出:圆角矩形、椭圆形、三角形、五角星等等…
当实际开发中,可以基于这些图形组合出各类各样的复合图形。
下面我们创建一个简单的圆形,将创建好的圆形实例添加到画布中即可
1
2
3
4
5
6
7
8
9
10
11
| const masterNode = new Ellipse({
x: 100,
y: 100,
width: 300,
height: 300,s
});
leafer.add(masterNode);
leafer.start();
|
实现效果
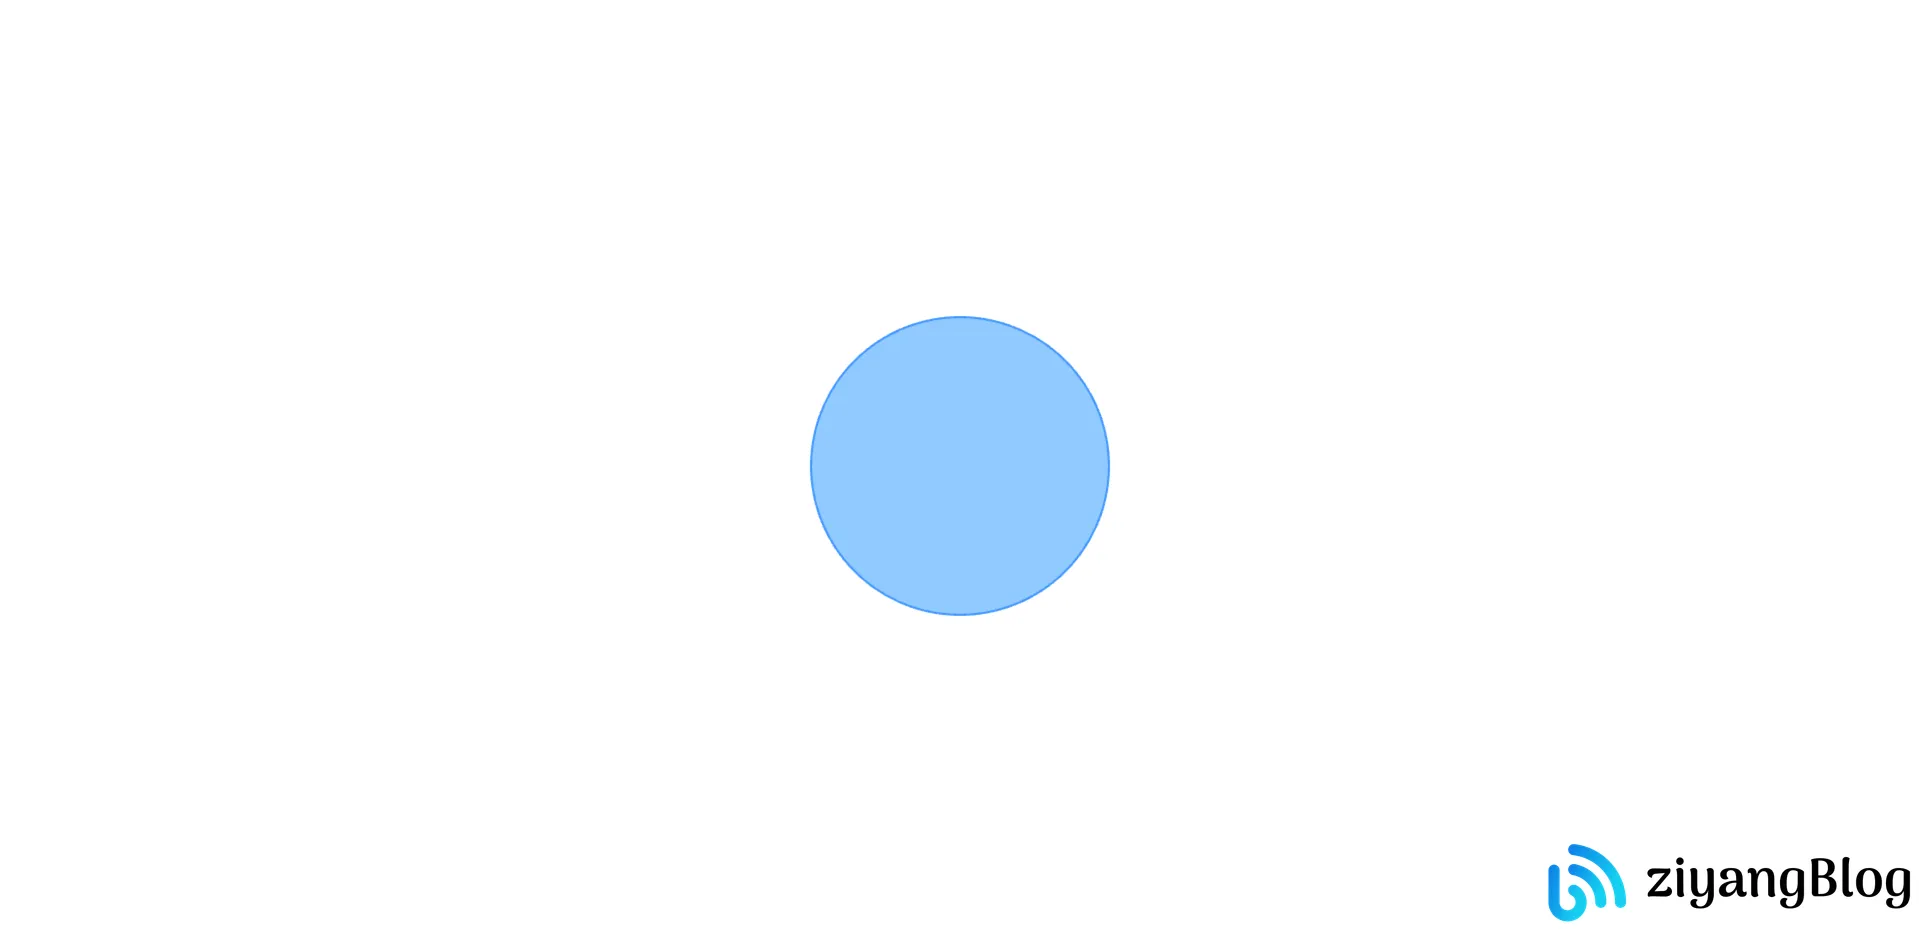
完成以上代码后,此时屏幕左上角会出现一个渲染好的圆形

设置样式
可以直接通过 masterNode.x=300 的方式进行修改,也可以通过 masterNode.set() 传入一个对象进行修改
下面这个示例我们将屏幕上的图形移动到屏幕的正中心
1
2
3
4
5
6
7
8
9
10
11
12
13
14
15
|
const width = window.innerWidth;
const height = window.innerHeight;
masterNode.set({
x: width / 2 - masterNode.width / 2,
y: height / 2 - masterNode.height / 2,
fill: "#91caff",
stroke: "#4096ff",
strokeWidth: 2,
})
|
实现效果

节点平均分布
这是项目上的一个绘图问题,需求时 多个节点 围绕着 中心圆 在边缘进行平均分布。
需求类似于下图,是多个子节点围绕着圆心平均分布的网路图

刚一接到这个需求,就一个头两个大,由于节点是动态渲染,个数及内容不定,所以当时我就知道需要通过某种数学公式进行计算点位,然而本来就孱弱的数学,更是早就还给了老师。
实现思路
实际计算圆边任意点坐标是一个初中数学题,可以使用极坐标转换和三角函数来计算。
假设圆的圆心坐标为 (x0, y0),半径为 r,要求的点的角度为 θ(以弧度表示)
- 将极坐标转换为直角坐标系中的坐标,使用以下公式计算圆边上点的直角坐标:
1
2
| x = x0 + r * cos(θ)
y = y0 + r * sin(θ)
|
这可以计算出相对于圆心的偏移量,cos(θ) 和 sin(θ) 分别代表给定角度 θ 的余弦和正弦值。
- 那么通过以上公式,我们只要知道 θ 就可以求出 x , y 的坐标了
我们需要先给定圆心坐标和角度,首先需要将角度转换为弧度,因为三角函数通常使用弧度作为输入。以下是如何将角度从度转换为弧度的计算公式:
具体实现
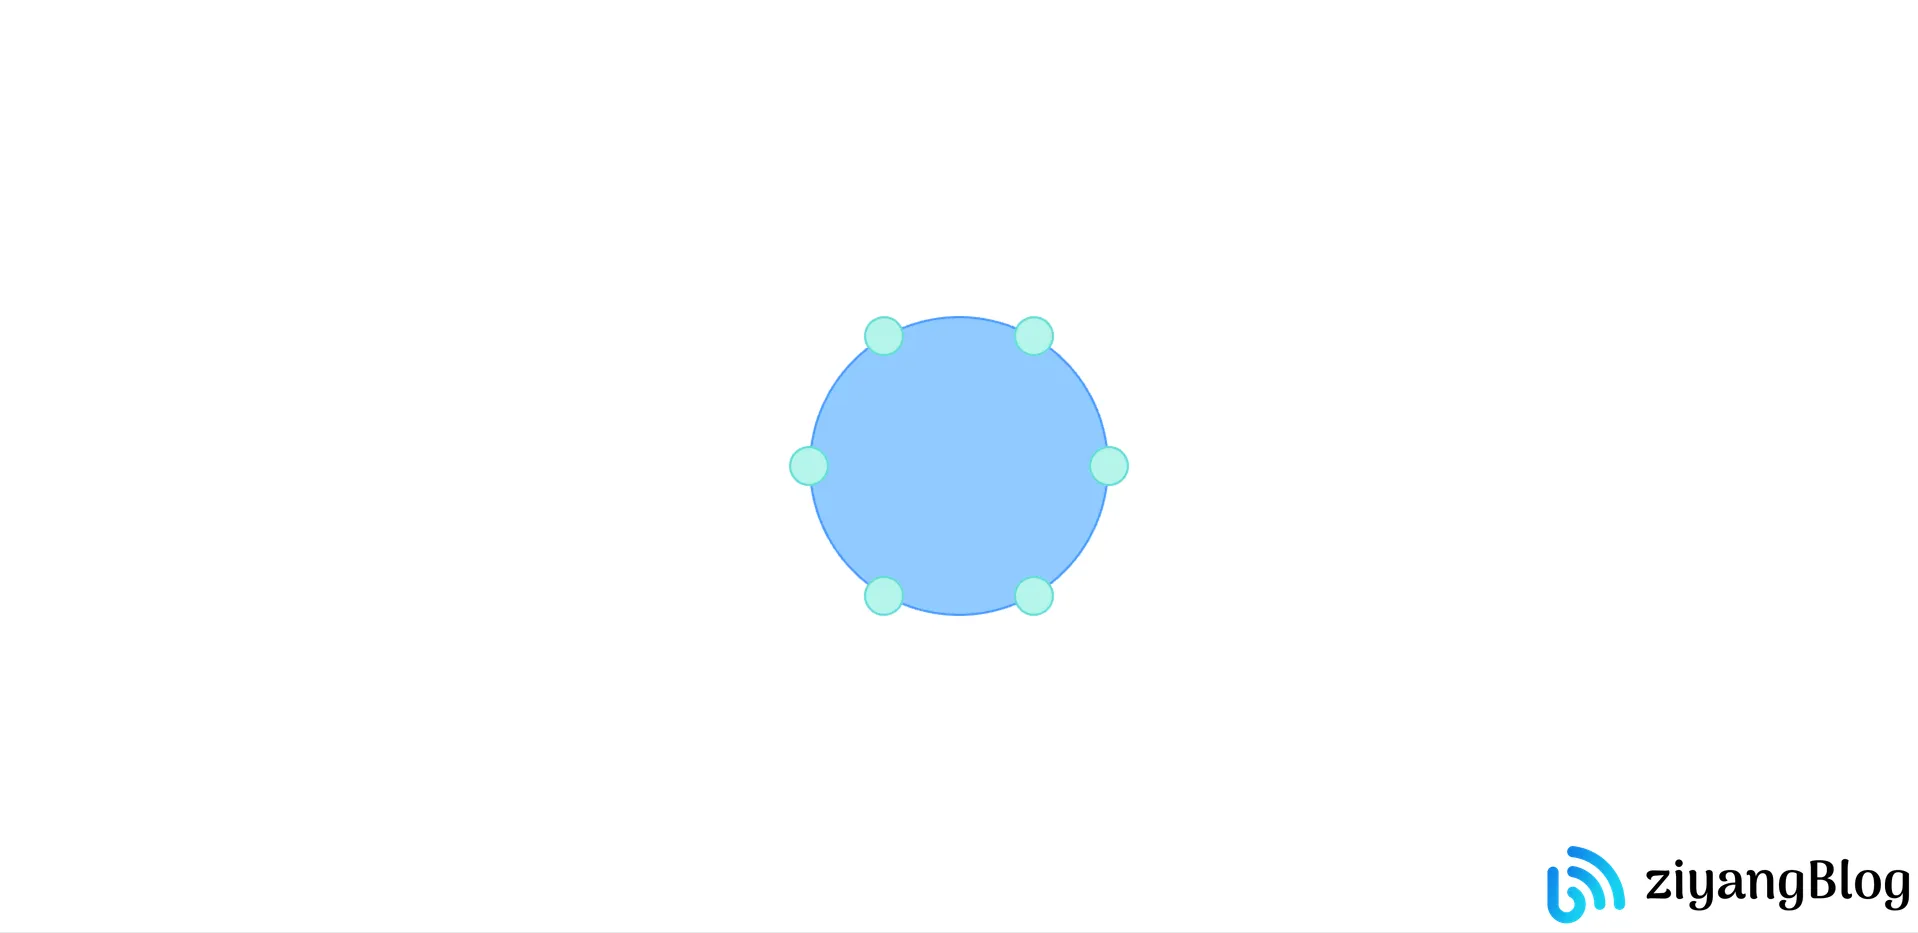
有了上面的实现思路,我们只要提供角度 与 圆形的坐标,即可计算出对应的点位。
同时因为我们需要平均分布,所以角度的计算是 360 / 节点个数。
1
2
3
4
5
6
7
8
9
10
11
12
13
14
15
16
17
18
19
20
21
22
23
24
25
26
27
28
29
| const createChildNode = (leafer, masterNode, count) => {
const baseNodeConf = {
width: 40,
height: 40,
fill: "#b5f5ec",
stroke: "#5cdbd3",
strokeWidth: 2,
}
const baseAngle = 360 / count;
const rx = masterNode.width / 2;
const ry = masterNode.height / 2;
const cx = masterNode.x + rx - (baseNodeConf.width / 2);
const cy = masterNode.y + ry - (baseNodeConf.height / 2);
for (let i = 0; i < count; i++) {
const angle = baseAngle * i;
const radian = angle * (Math.PI / 180);
baseNodeConf.x = cx + rx * Math.cos(radian);
baseNodeConf.y = cy + ry * Math.sin(radian);
const circle = new Ellipse(baseNodeConf)
leafer.add(circle)
}
}
createChildNode(leafer, masterNode, 6)
|
实现效果

其他示例
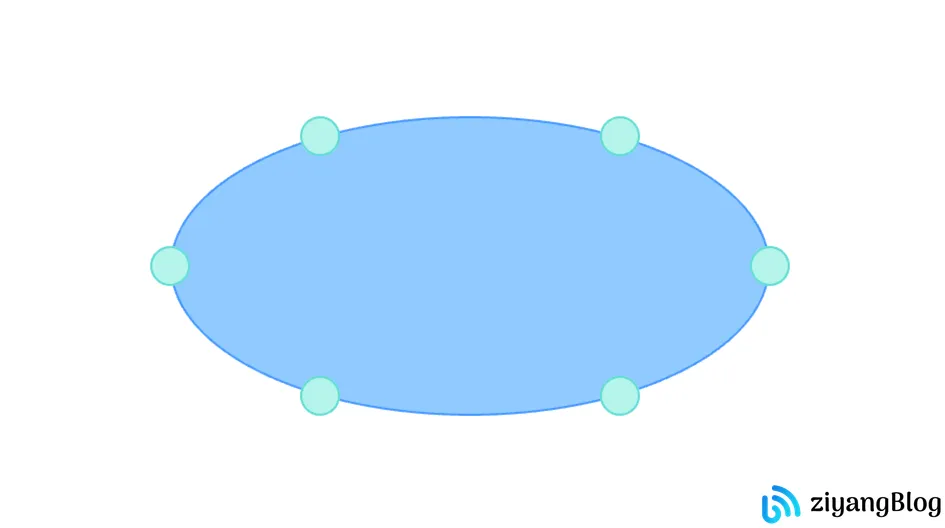
对于这套公式,可以任意修改圆的大小及形状,节点都会平均分布, 例如椭圆形

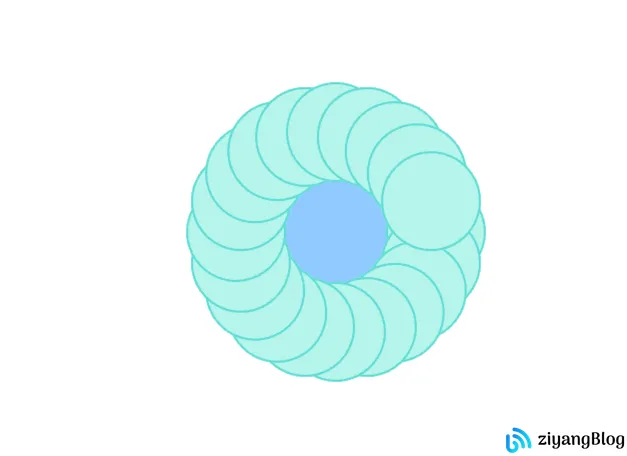
同时,我还发现了组合出了一个有趣的图形

完整代码
App.vue
1
2
3
4
5
6
7
8
9
10
11
12
13
14
15
| <script setup>
import { nextTick } from 'vue'
import { createGraph } from './graph';
nextTick(()=> createGraph("main"))
</script>
<template>
<main id="main"></main>
</template>
<style scoped>
#main {
height: 100%;
}
</style>
|
graph.js
1
2
3
4
5
6
7
8
9
10
11
12
13
14
15
16
17
18
19
20
21
22
23
24
25
26
27
28
29
30
31
32
33
34
35
36
37
38
39
40
41
42
43
44
45
46
47
48
49
50
51
52
53
54
55
56
57
58
| import { Ellipse, Leafer } from 'leafer-ui';
const createChildNode = (leafer, masterNode, count) => {
const baseNodeConf = {
width: 100,
height: 100,
fill: "#b5f5ec",
stroke: "#5cdbd3",
strokeWidth: 2,
}
const baseAngle = 360 / count;
const rx = masterNode.width / 2;
const ry = masterNode.height / 2;
const cx = masterNode.x + rx - baseNodeConf.width / 2;
const cy = masterNode.y + ry - baseNodeConf.height / 2;
for (let i = 0; i < count; i++) {
const angle = baseAngle * i;
const radian = angle * (Math.PI / 180);
baseNodeConf.x = cx + rx * Math.cos(radian);
baseNodeConf.y = cy + ry * Math.sin(radian);
const circle = new Ellipse(baseNodeConf)
leafer.add(circle)
}
}
const createGraph = (view) => {
const width = window.innerWidth;
const height = window.innerHeight - 10;
const leafer = new Leafer({
view,
width,
height,
fill: '#fff',
wheel: { zoomMode: true },
move: { dragEmpty: true },
start: false
})
const masterNode = new Ellipse({
width: 200,
height: 200,
fill: "#91caff",
stroke: "#4096ff",
strokeWidth: 2,
})
masterNode.set({
x: width / 2 - masterNode.width / 2,
y: height / 2 - masterNode.height / 2
})
leafer.add(masterNode)
createChildNode(leafer, masterNode, 20)
leafer.start()
}
export { createGraph };
|


